Plot kernel density estimation of single-species activity
Source:R/activityDensity.R
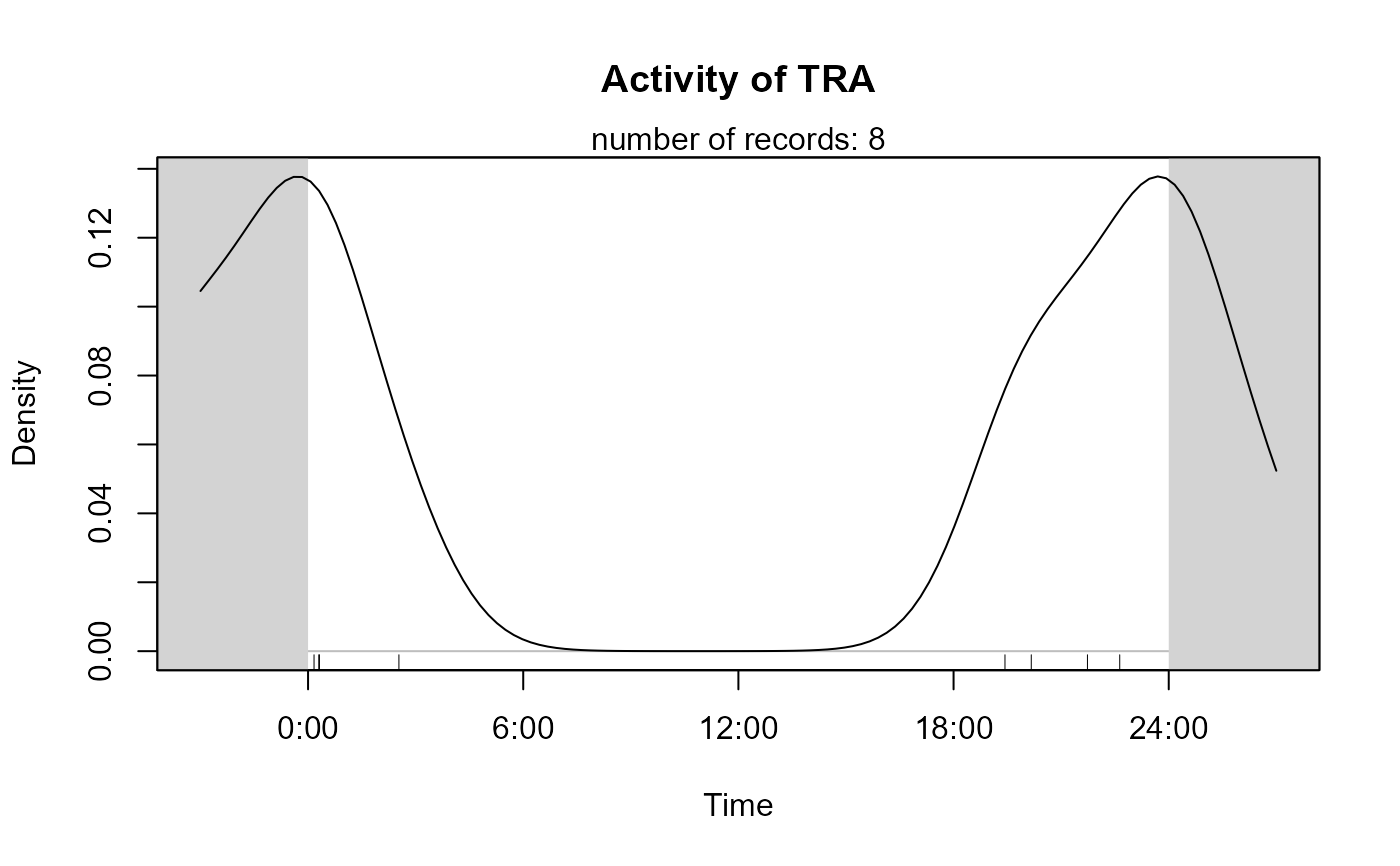
activityDensity.RdThe function plots a kernel density estimation of species diel activity
using function densityPlot from package
overlap.
activityDensity(
  recordTable,
  species,
  allSpecies = FALSE,
  speciesCol = "Species",
  recordDateTimeCol = "DateTimeOriginal",
  recordDateTimeFormat = "ymd HMS",
  plotR = TRUE,
  writePNG = FALSE,
  plotDirectory,
  createDir = FALSE,
  pngMaxPix = 1000,
  add.rug = TRUE,
  ...
)
Arguments
- recordTable
data.frame. the record table created by
recordTable- species
Name of the species for which to create an kernel density plot of activity
- allSpecies
logical. Create plots for all species in
speciesColofrecordTable? Overrides argumentspecies- speciesCol
character. name of the column specifying species names in
recordTable- recordDateTimeCol
character. name of the column specifying date and time in
recordTable- recordDateTimeFormat
character. format of column
recordDateTimeColinrecordTable- plotR
logical. Show plots in R graphics device?
- writePNG
logical. Create pngs of the plots?
- plotDirectory
character. Directory in which to create png plots if
writePNG = TRUE- createDir
logical. Create
plotDirectoryifwritePNG = TRUE?- pngMaxPix
integer. image size of png (pixels along x-axis)
- add.rug
logical. add a rug to the plot?
- ...
additional arguments to be passed to function
densityPlot
Value
Returns invisibly a vector of species record observation times in
radians, i.e. scaled to [\(0, 2\pi\)]. If allSpecies == TRUE, all
species' vectors are returned in an invisible named list.
Details
species must be in the speciesCol of recordTable.
recordDateTimeFormat defaults to the "YYYY-MM-DD HH:MM:SS"
convention, e.g. "2014-09-30 22:59:59". recordDateTimeFormat can be
interpreted either by base-R via strptime or in
lubridate via parse_date_time (argument
"orders"). lubridate will be used if there are no "%" characters in
recordDateTimeFormat.
For "YYYY-MM-DD HH:MM:SS", recordDateTimeFormat would be either
"%Y-%m-%d %H:%M:%S" or "ymd HMS". For details on how to specify date
and time formats in R see strptime or
parse_date_time.
References
Martin Ridout and Matthew Linkie (2009). Estimating overlap of
daily activity patterns from camera trap data. Journal of Agricultural,
Biological and Environmental Statistics, 14(3), 322-337
Mike Meredith
and Martin Ridout (2018). overlap: Estimates of coefficient of overlapping
for animal activity patterns. R package version 0.3.2.
https://CRAN.R-project.org/package=overlap
See also
Examples
if(requireNamespace("overlap")) {
# load record table
data(recordTableSample)
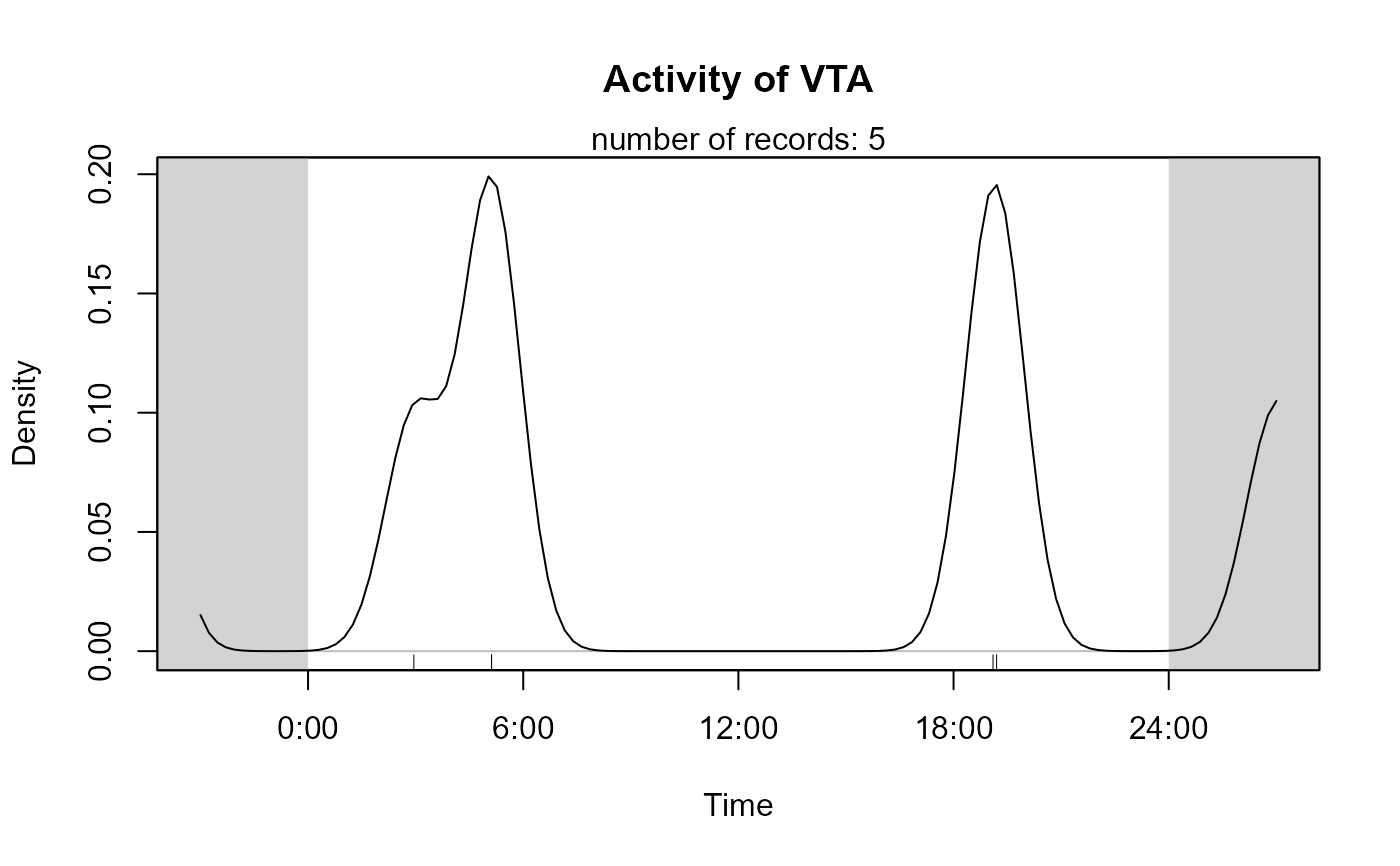
species4activity <- "VTA" # = Viverra tangalunga, Malay Civet
activityDensity(recordTable = recordTableSample,
species = species4activity)
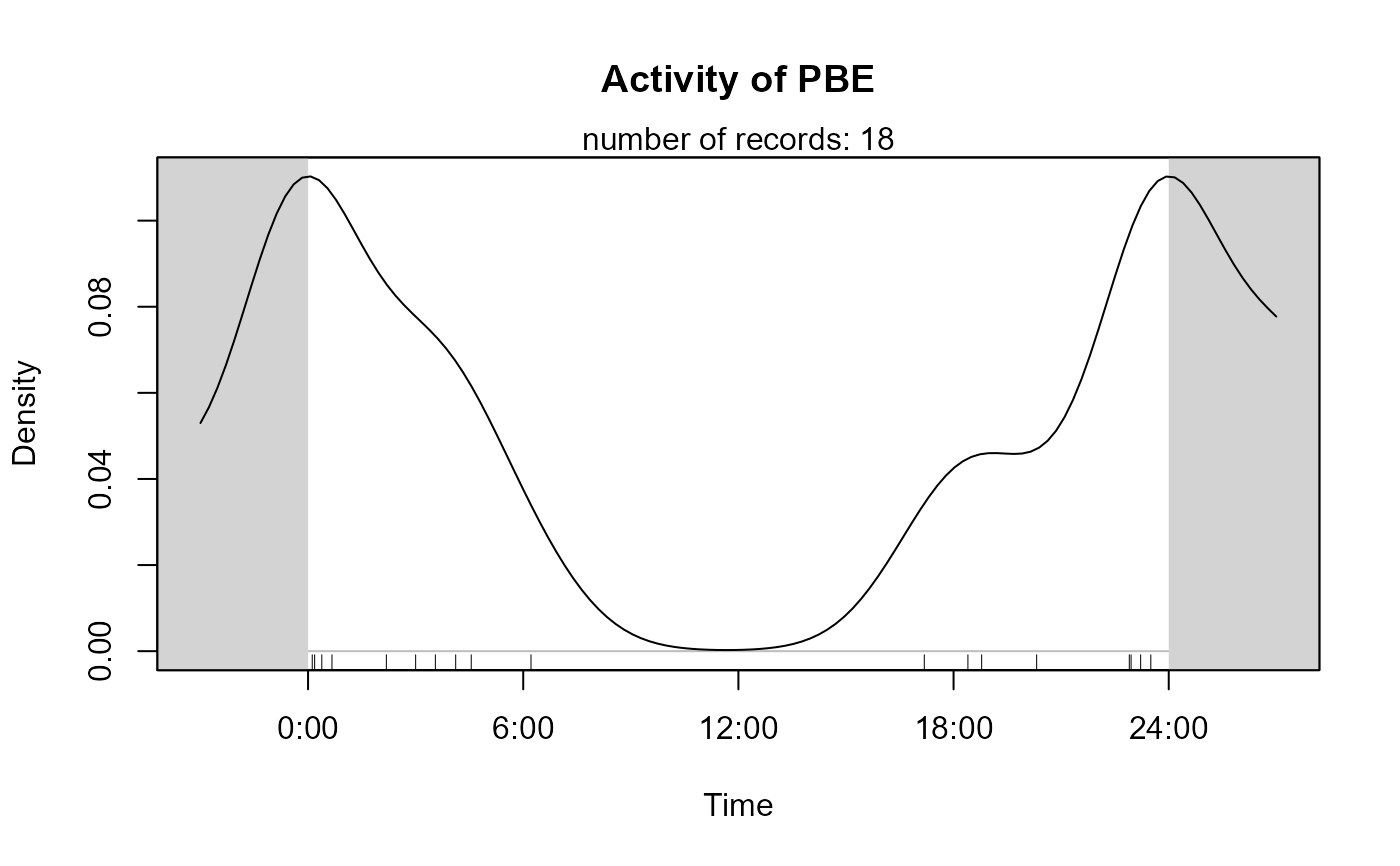
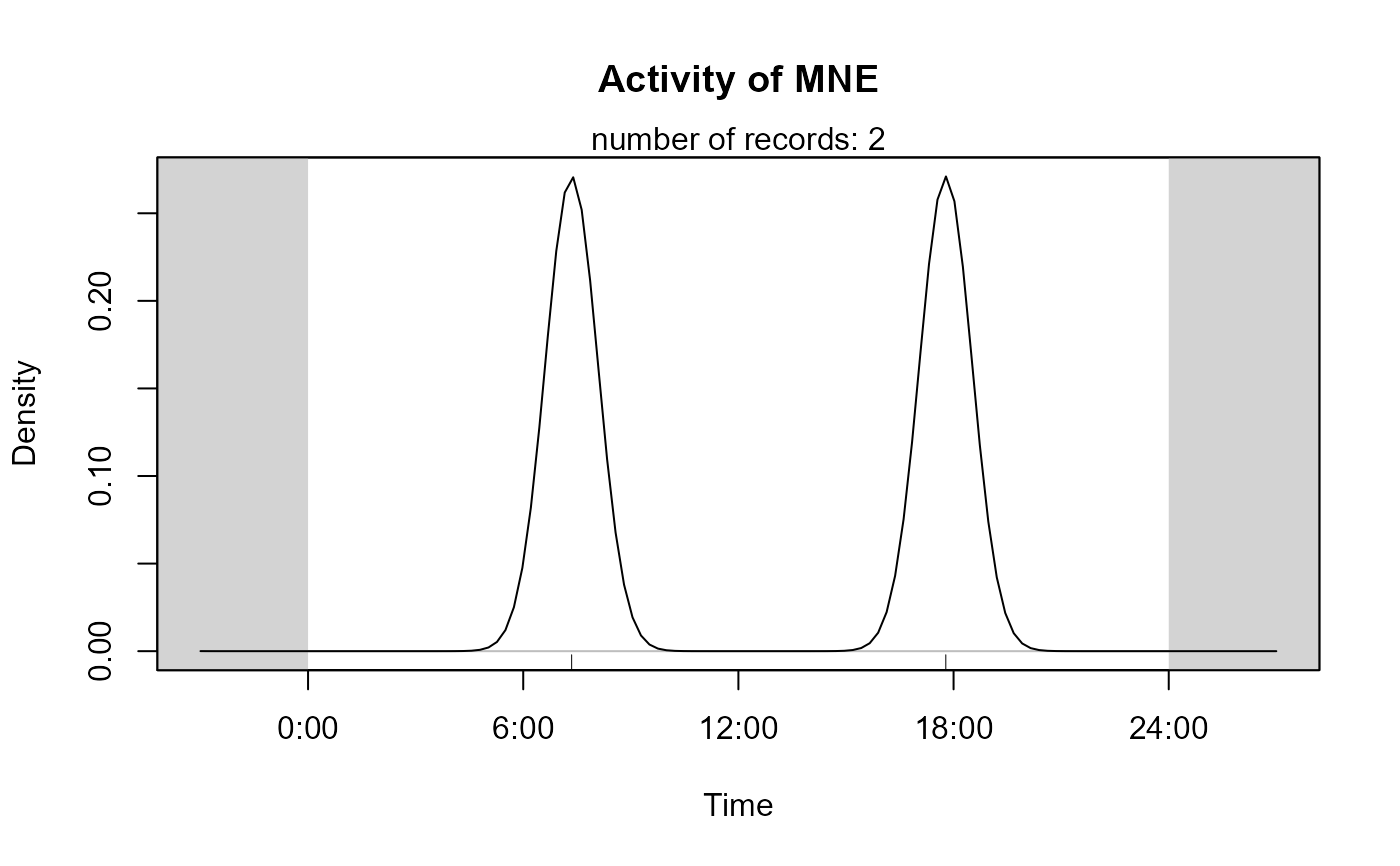
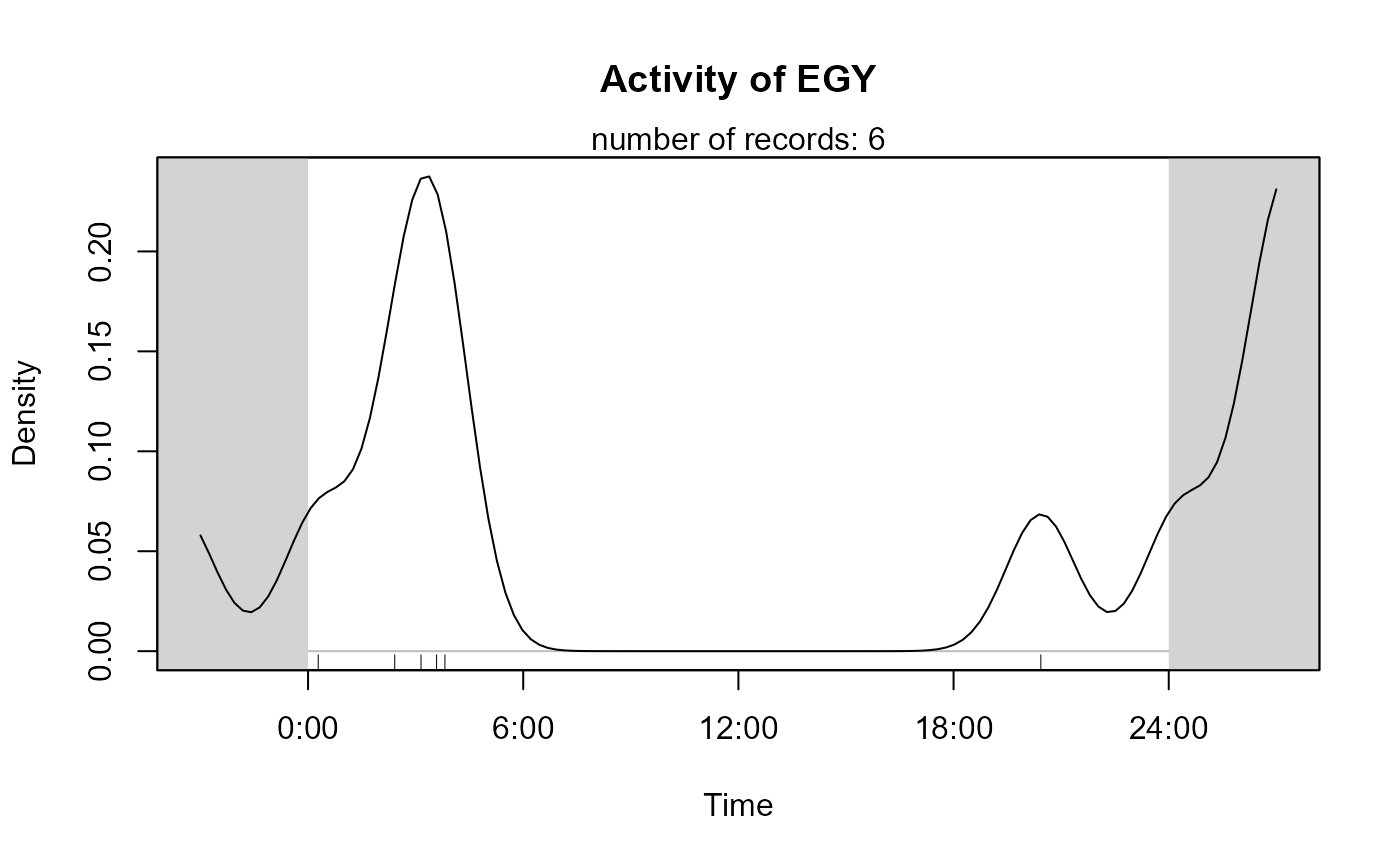
# all species at once
activityDensity(recordTable = recordTableSample,
allSpecies = TRUE,
writePNG = FALSE,
plotR = TRUE,
add.rug = TRUE)
}