Generates simulated camera trap data and a corresponding species record table.
The output mimics the structure required by camtrapR, making it useful
for creating reproducible examples, testing pipelines, and demonstrating
package functionality.
simulateCamtrapData(
  nStations = 10,
  camerasPerStation = 1,
  duration_days = 40,
  nSeasons = 1,
  nSpecies = 8,
  nRecords = 300,
  startDate = "2023-01-01",
  probProblem = 0,
  bbox = c(xmin = 117.25, xmax = 117.5, ymin = 5.3, ymax = 5.5),
  covariates = list(continuous = list(elev = c(1000, 200)), categorical = list(habitat =
    3)),
  dateFormat = "ymd",
  seed = NULL
)
Arguments
- nStations
Integer. The number of camera trap stations to simulate. Default is 10.
- camerasPerStation
Integer (1 or 2). Number of cameras per station. If 2, a
Cameracolumn is generated to distinguish between devices at the same station. Default is 1.- duration_days
Numeric. The average deployment duration in days. Actual durations will have slight random jitter. Default is 40.
- nSeasons
Integer. The number of seasons to simulate. If > 1, deployments are staggered by 180 days. Default is 1.
- nSpecies
Integer. The total number of distinct species to simulate. Default is 8.
- nRecords
Integer. The total number of species records (images/events) to distribute across the active deployments. Default is 200.
- startDate
Character. The base start date for the first season's deployments, in "YYYY-MM-DD" format. Default is "2023-01-01".
- probProblem
Numeric (0 to 1). The probability that a camera experiences a malfunction, triggering
Problem1_fromandProblem1_todates. Default is 0 (no problems).- bbox
Numeric vector of length 4. Bounding box
c(xmin, xmax, ymin, ymax)used to generate random deployment coordinates in decimal degrees.- covariates
List. Specifies the covariates to simulate. Must contain
continuous(a named list ofc(mean, sd)) and/orcategorical(a named list specifying the number of factor levels).- dateFormat
Character. A
lubridate-style format string specifying howSetup_dateandRetrieval_dateshould be formatted (e.g.,"ymd","dmy HMS","mdy").- seed
Numeric. A seed for the random number generator to ensure reproducible output.
Value
A list containing two data.frames:
camtrapsDeployment metadata including Station, Camera (optional), Season (optional), longitude, latitude, Setup/Retrieval dates, Problem dates, and covariates.
recordTableSimulated species record table including Station, Camera (optional), Season (optional), Species, and strictly formatted DateTimeOriginal, Date, and Time columns.
Details
The function simulates realistic deployment metadata and species detections.
Species abundances are generated using a skewed, Zipf-like (harmonic) distribution,
ensuring a realistic mix of common and rare species. Detection times are drawn uniformly
across the active deployment periods. If probProblem > 0, a subset of
cameras will simulate a single malfunction period (Problem1_from and Problem1_to).
Cameras are set up and retrieved in the daytime.
Note: The initial draft of this function was generated with the assistance of an AI language model and subsequently modified.
Examples
# Simulate basic data (10 stations, 1 camera each, 1 season)
camera_data_simple <- simulateCamtrapData()
camop_simple <- cameraOperation(camera_data_simple$camtraps,
setupCol = "Setup_date",
retrievalCol = "Retrieval_date")
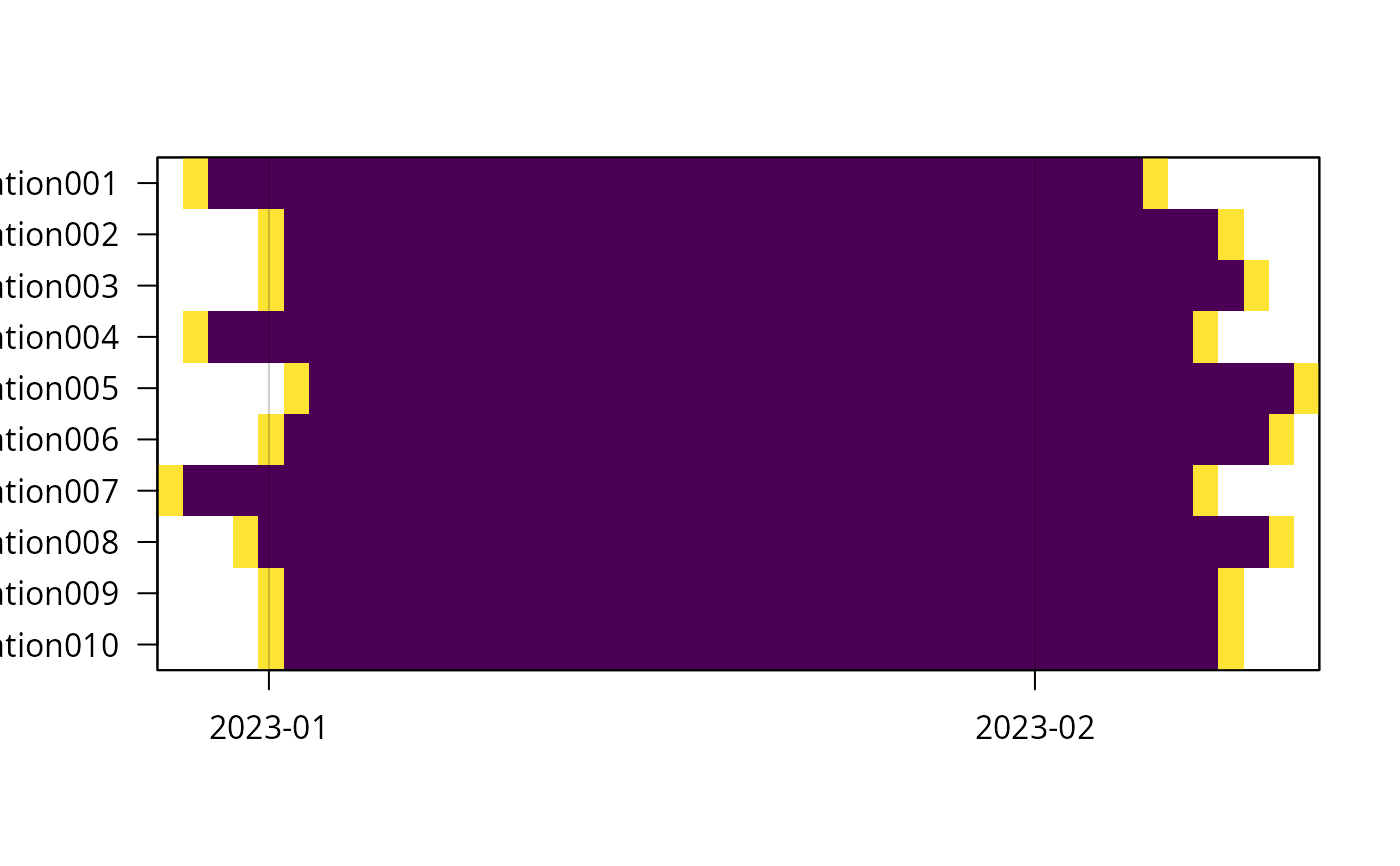
plot(camop_simple)
 head(camera_data_simple$camtraps)
#> Station longitude latitude Setup_date Retrieval_date elev habitat
#> 1 Station001 117.2702 5.47492 2022-12-30 2023-02-06 1187.1 habitat_2
#> 2 Station002 117.4586 5.33499 2023-01-02 2023-02-09 1035.3 habitat_2
#> 3 Station003 117.4002 5.30685 2023-01-02 2023-02-10 1048.7 habitat_1
#> 4 Station004 117.2893 5.36408 2022-12-30 2023-02-08 1324.7 habitat_3
#> 5 Station005 117.2519 5.38047 2023-01-03 2023-02-12 1022.4 habitat_2
#> 6 Station006 117.3666 5.33913 2023-01-02 2023-02-11 973.2 habitat_2
head(camera_data_simple$recordTable)
#> Record table based on 1 station and 6 records of a total of 2 species:
#> # A tibble: 6 × 5
#> Station Species DateTimeOriginal Date Time
#> <chr> <chr> <chr> <chr> <chr>
#> 1 Station001 Sp_01 2022-12-31 21:43:55 2022-12-31 21:43:55
#> 2 Station001 Sp_01 2023-01-02 09:10:09 2023-01-02 09:10:09
#> 3 Station001 Sp_01 2023-01-02 14:47:08 2023-01-02 14:47:08
#> 4 Station001 Sp_06 2023-01-05 21:57:05 2023-01-05 21:57:05
#> 5 Station001 Sp_01 2023-01-06 13:33:55 2023-01-06 13:33:55
#> 6 Station001 Sp_01 2023-01-07 13:58:01 2023-01-07 13:58:01
# Simulate multi-season, multi-camera data with custom covariates
# and camera malfuncion (problem columns)
camera_data_complex <- simulateCamtrapData(
nStations = 10,
camerasPerStation = 2,
nSeasons = 2,
dateFormat = "ymd HMS",
covariates = list(continuous = list(elevation = c(500, 50)),
categorical = list(treatment = 2)),
probProblem = 0.5
)
camop_complex <- cameraOperation(camera_data_complex$camtraps,
setupCol = "Setup_date",
retrievalCol = "Retrieval_date",
sessionCol = "Season",
cameraCol = "Camera",
hasProblems = TRUE,
byCamera = FALSE,
allCamsOn = FALSE,
camerasIndependent = FALSE, # this is made up, not simulated
dateFormat = "ymd HMS")
summary(camop_complex)
#> === Camera Trap Station Operation Summary ===
#>
#> SURVEY SPECIFICATION
#> Station column: Station
#> Session column: Season
#> Setup column: Setup_date
#> Retrieval column: Retrieval_date
#>
#> PERIOD
#> From: 2022-12-29
#> To: 2023-08-13
#>
#> DIMENSIONS
#> Stations: 10
#> Sessions: 2
#> Days: 228
#>
#> EFFORT
#> Active days: 94 out of 228 days (at least 1 station active)
#> Active trap-days: 739.9 (sum of effort across all stations and days)
#> Problem trap-days: 4 (0.1% of 4560 station-days)
#> Not set up trap-days: 3738 (82.0% of 4560 station-days)
#>
#> STATION-LEVEL SUMMARY
#> Station Session Monitored Active Problem
#> -----------------------------------------------------
#> Station001 1 42 37.4 0
#> Station002 1 43 37.7 0
#> Station003 1 40 36.6 0
#> Station004 1 41 39.3 0
#> Station005 1 40 37.8 0
#> Station006 1 42 35.4 0
#> Station007 1 40 35.4 0
#> Station008 1 41 39.6 0
#> Station009 1 41 36.3 0
#> Station010 1 39 33.7 0
#>
#> ... 10 more row(s) not shown (use `summary(nStationsMax = ...)` to see more)
#>
#>
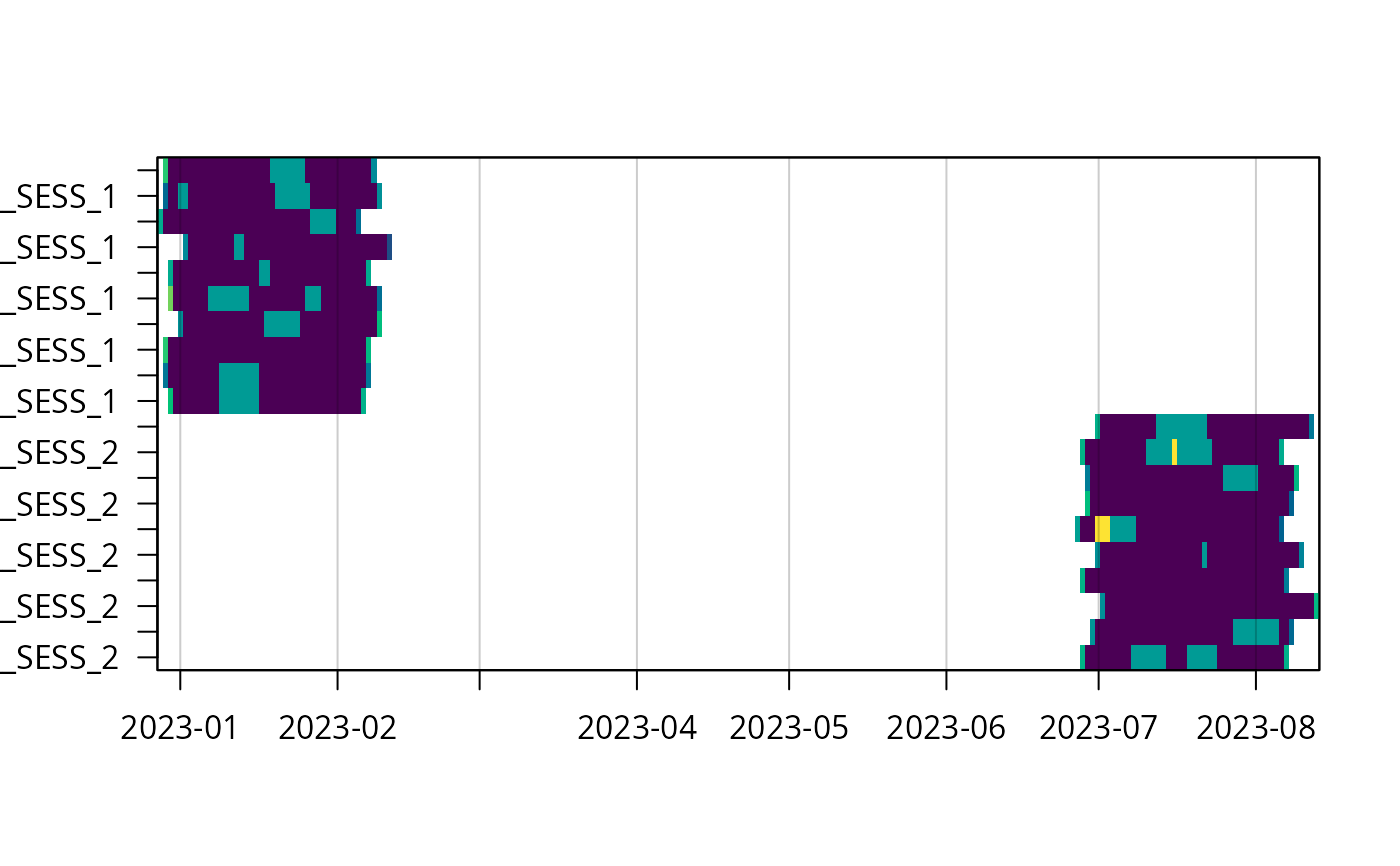
plot(camop_complex)
head(camera_data_simple$camtraps)
#> Station longitude latitude Setup_date Retrieval_date elev habitat
#> 1 Station001 117.2702 5.47492 2022-12-30 2023-02-06 1187.1 habitat_2
#> 2 Station002 117.4586 5.33499 2023-01-02 2023-02-09 1035.3 habitat_2
#> 3 Station003 117.4002 5.30685 2023-01-02 2023-02-10 1048.7 habitat_1
#> 4 Station004 117.2893 5.36408 2022-12-30 2023-02-08 1324.7 habitat_3
#> 5 Station005 117.2519 5.38047 2023-01-03 2023-02-12 1022.4 habitat_2
#> 6 Station006 117.3666 5.33913 2023-01-02 2023-02-11 973.2 habitat_2
head(camera_data_simple$recordTable)
#> Record table based on 1 station and 6 records of a total of 2 species:
#> # A tibble: 6 × 5
#> Station Species DateTimeOriginal Date Time
#> <chr> <chr> <chr> <chr> <chr>
#> 1 Station001 Sp_01 2022-12-31 21:43:55 2022-12-31 21:43:55
#> 2 Station001 Sp_01 2023-01-02 09:10:09 2023-01-02 09:10:09
#> 3 Station001 Sp_01 2023-01-02 14:47:08 2023-01-02 14:47:08
#> 4 Station001 Sp_06 2023-01-05 21:57:05 2023-01-05 21:57:05
#> 5 Station001 Sp_01 2023-01-06 13:33:55 2023-01-06 13:33:55
#> 6 Station001 Sp_01 2023-01-07 13:58:01 2023-01-07 13:58:01
# Simulate multi-season, multi-camera data with custom covariates
# and camera malfuncion (problem columns)
camera_data_complex <- simulateCamtrapData(
nStations = 10,
camerasPerStation = 2,
nSeasons = 2,
dateFormat = "ymd HMS",
covariates = list(continuous = list(elevation = c(500, 50)),
categorical = list(treatment = 2)),
probProblem = 0.5
)
camop_complex <- cameraOperation(camera_data_complex$camtraps,
setupCol = "Setup_date",
retrievalCol = "Retrieval_date",
sessionCol = "Season",
cameraCol = "Camera",
hasProblems = TRUE,
byCamera = FALSE,
allCamsOn = FALSE,
camerasIndependent = FALSE, # this is made up, not simulated
dateFormat = "ymd HMS")
summary(camop_complex)
#> === Camera Trap Station Operation Summary ===
#>
#> SURVEY SPECIFICATION
#> Station column: Station
#> Session column: Season
#> Setup column: Setup_date
#> Retrieval column: Retrieval_date
#>
#> PERIOD
#> From: 2022-12-29
#> To: 2023-08-13
#>
#> DIMENSIONS
#> Stations: 10
#> Sessions: 2
#> Days: 228
#>
#> EFFORT
#> Active days: 94 out of 228 days (at least 1 station active)
#> Active trap-days: 739.9 (sum of effort across all stations and days)
#> Problem trap-days: 4 (0.1% of 4560 station-days)
#> Not set up trap-days: 3738 (82.0% of 4560 station-days)
#>
#> STATION-LEVEL SUMMARY
#> Station Session Monitored Active Problem
#> -----------------------------------------------------
#> Station001 1 42 37.4 0
#> Station002 1 43 37.7 0
#> Station003 1 40 36.6 0
#> Station004 1 41 39.3 0
#> Station005 1 40 37.8 0
#> Station006 1 42 35.4 0
#> Station007 1 40 35.4 0
#> Station008 1 41 39.6 0
#> Station009 1 41 36.3 0
#> Station010 1 39 33.7 0
#>
#> ... 10 more row(s) not shown (use `summary(nStationsMax = ...)` to see more)
#>
#>
plot(camop_complex)